Introducing A6Platform

Production, equipment, environment and energy—in one view.

One platform. Four focused modules. Ask the floor in plain language. AI proposes. You approve.

  • 01A6.iAndon
  • 02A6.Condition
  • 03A6.Environment
  • 04A6.Energy

Confirm functions, connections and scope on site.

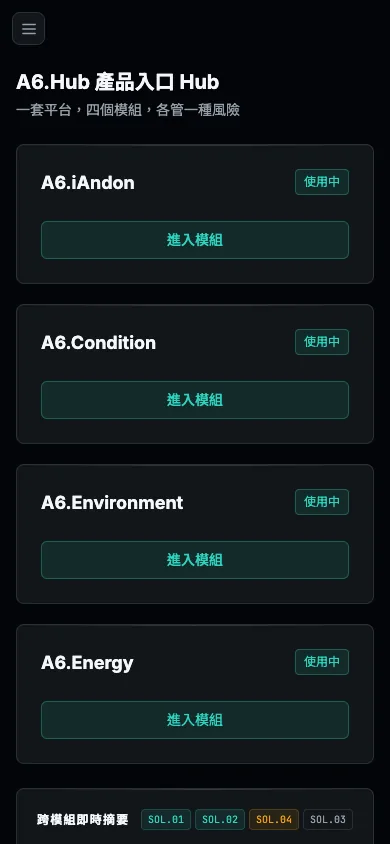
A6Platform Service portal (Hub) screen (UI shown in Traditional Chinese)
01/04Service portal (Hub)
UI shown in Traditional Chinese.

SHEET 01Platform Tour

The screens you check every day.

Scroll to step through

01A6.Hub

Service portal

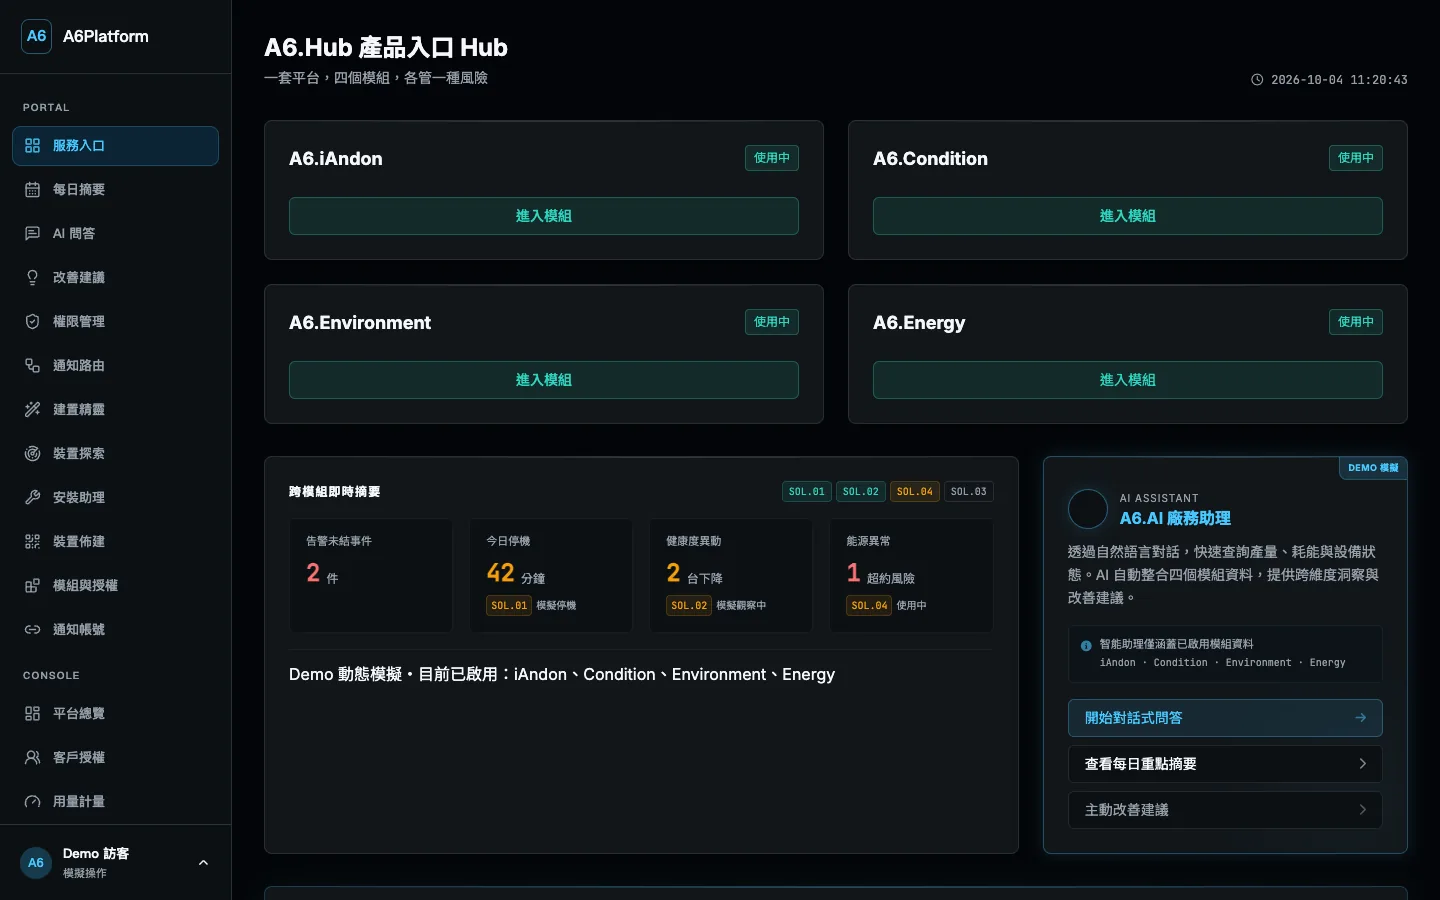
Enter all four modules from one service portal; permissions, notifications and module access are set in one admin console.

  1. L1

    Service portal

    Each module has its own entry, alongside a cross-module summary: open alerts, today's downtime, health changes and energy anomalies.

  2. L2

    Module view

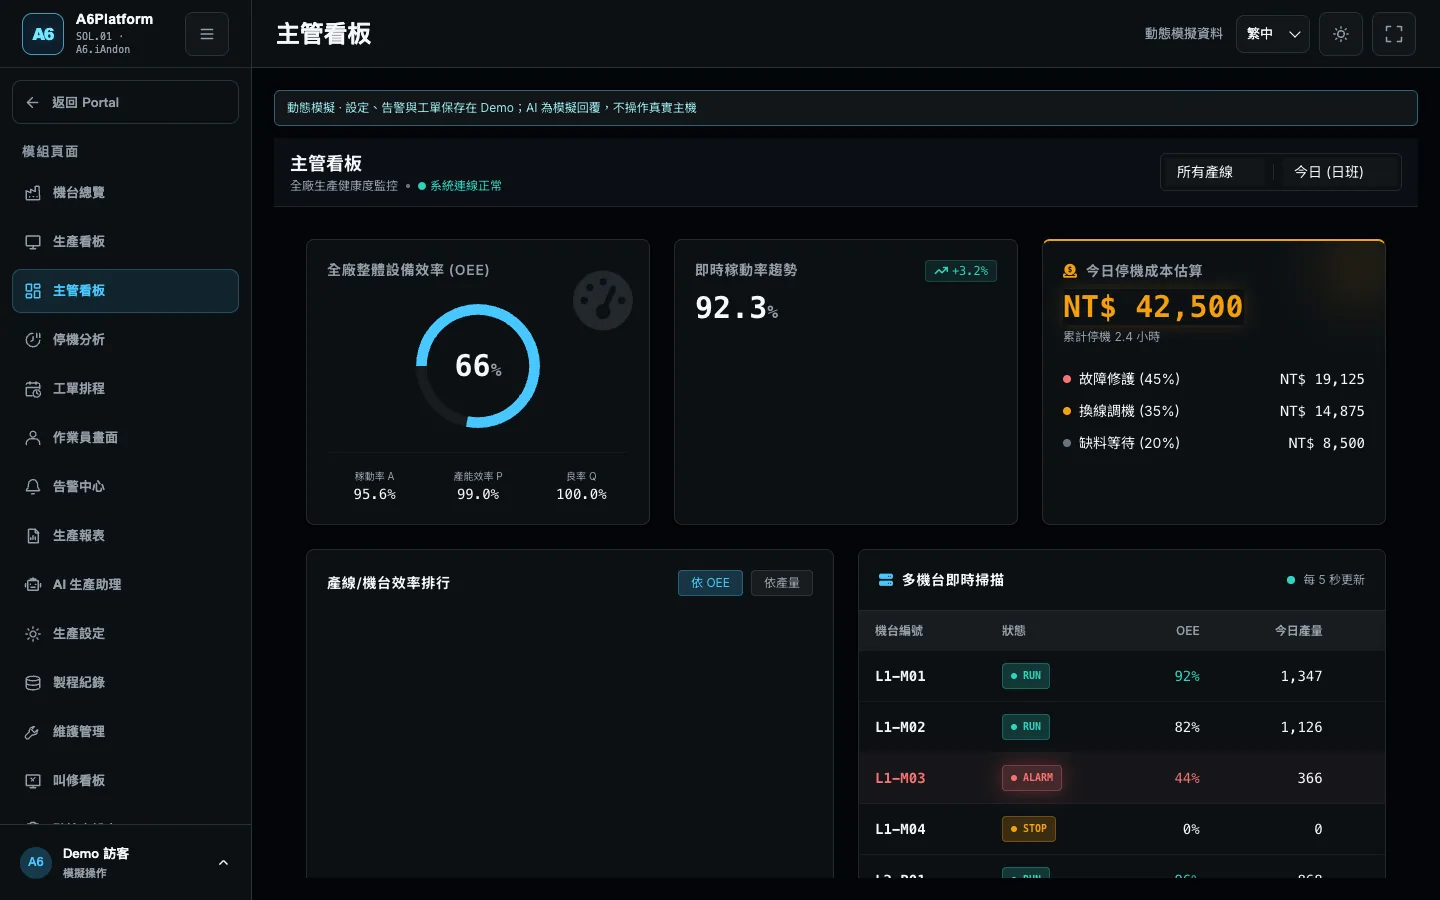
    From the portal into a module — for example the A6.iAndon machine overview, with each machine's status, work order and downtime side by side.
A6Platform Service portal (Hub) screen (UI shown in Traditional Chinese)
A6Platform Manager dashboard screen (UI shown in Traditional Chinese)
A6Platform Vibration analysis screen (UI shown in Traditional Chinese)
A6Platform Environment war room screen (UI shown in Traditional Chinese)
A6Platform Energy war room screen (UI shown in Traditional Chinese)
PRT-G02Service portal (Hub)UI shown in Traditional Chinese.
  1. 01A6.Hub

    Service portal

    Enter all four modules from one service portal; permissions, notifications and module access are set in one admin console.

    1. L1

      Service portal

      Each module has its own entry, alongside a cross-module summary: open alerts, today's downtime, health changes and energy anomalies.

    2. L2

      Module view

      From the portal into a module — for example the A6.iAndon machine overview, with each machine's status, work order and downtime side by side.
    A6Platform Service portal (Hub) screen (UI shown in Traditional Chinese)
    PRT-G02Service portal (Hub)UI shown in Traditional Chinese.
    1. 1Four module entries
    2. 2Cross-module summary
    3. 3A6.AI assistant
  2. 02A6.iAndon

    Production Management & Real-Time Andon

    Which machine stopped? Where is the work order?

    Discuss machine status, downtime reasons and schedules alongside a production Andon display.

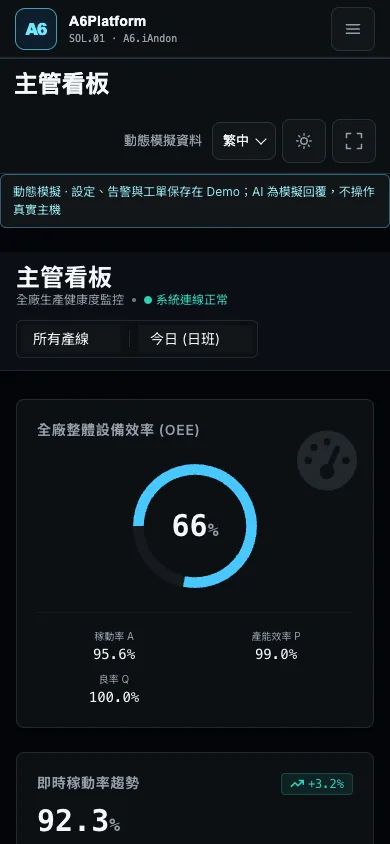
    A6Platform Manager dashboard screen (UI shown in Traditional Chinese)
    IAN-G16Manager dashboardUI shown in Traditional Chinese.
    1. 1Plant OEE ring
    2. 2Live utilization
    3. 3Multi-machine scan
  3. 03A6.Condition

    Equipment Health & Preventive Maintenance

    Which machine needs attention first?

    Discuss vibration, temperature and current readings, trends and maintenance review.

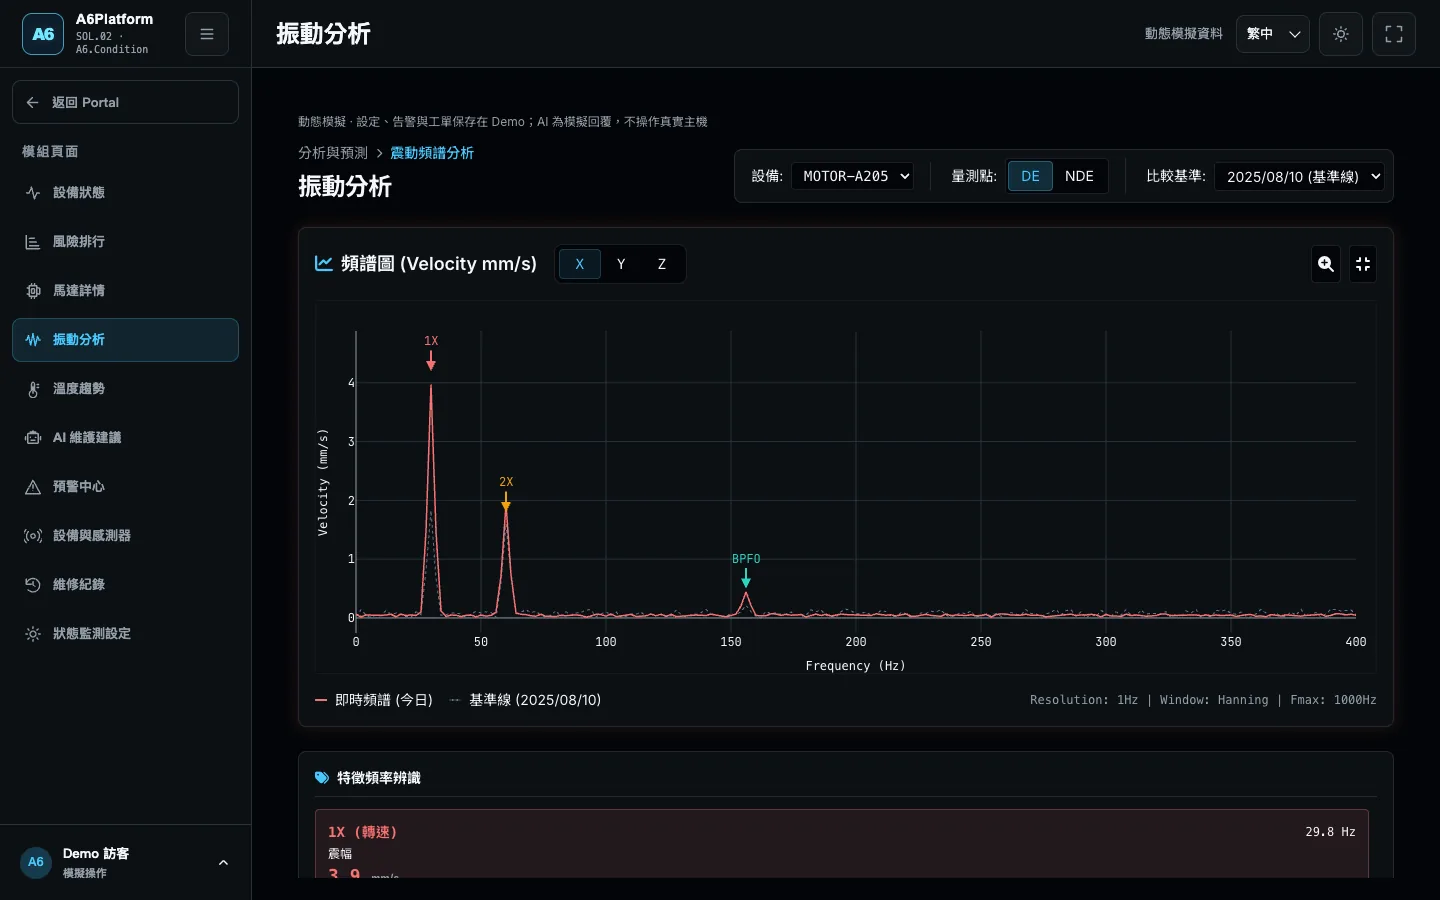
    A6Platform Vibration analysis screen (UI shown in Traditional Chinese)
    PHM-G45Vibration analysisUI shown in Traditional Chinese.
    1. 11X running-speed peak
    2. 2BPFO frequency
    3. 3Compared with baseline
  4. 04A6.Environment

    Environmental Controls & Thermal Risk Monitoring

    Which point has crossed a threshold?

    Discuss environmental, cold-chain and panel readings with event history.

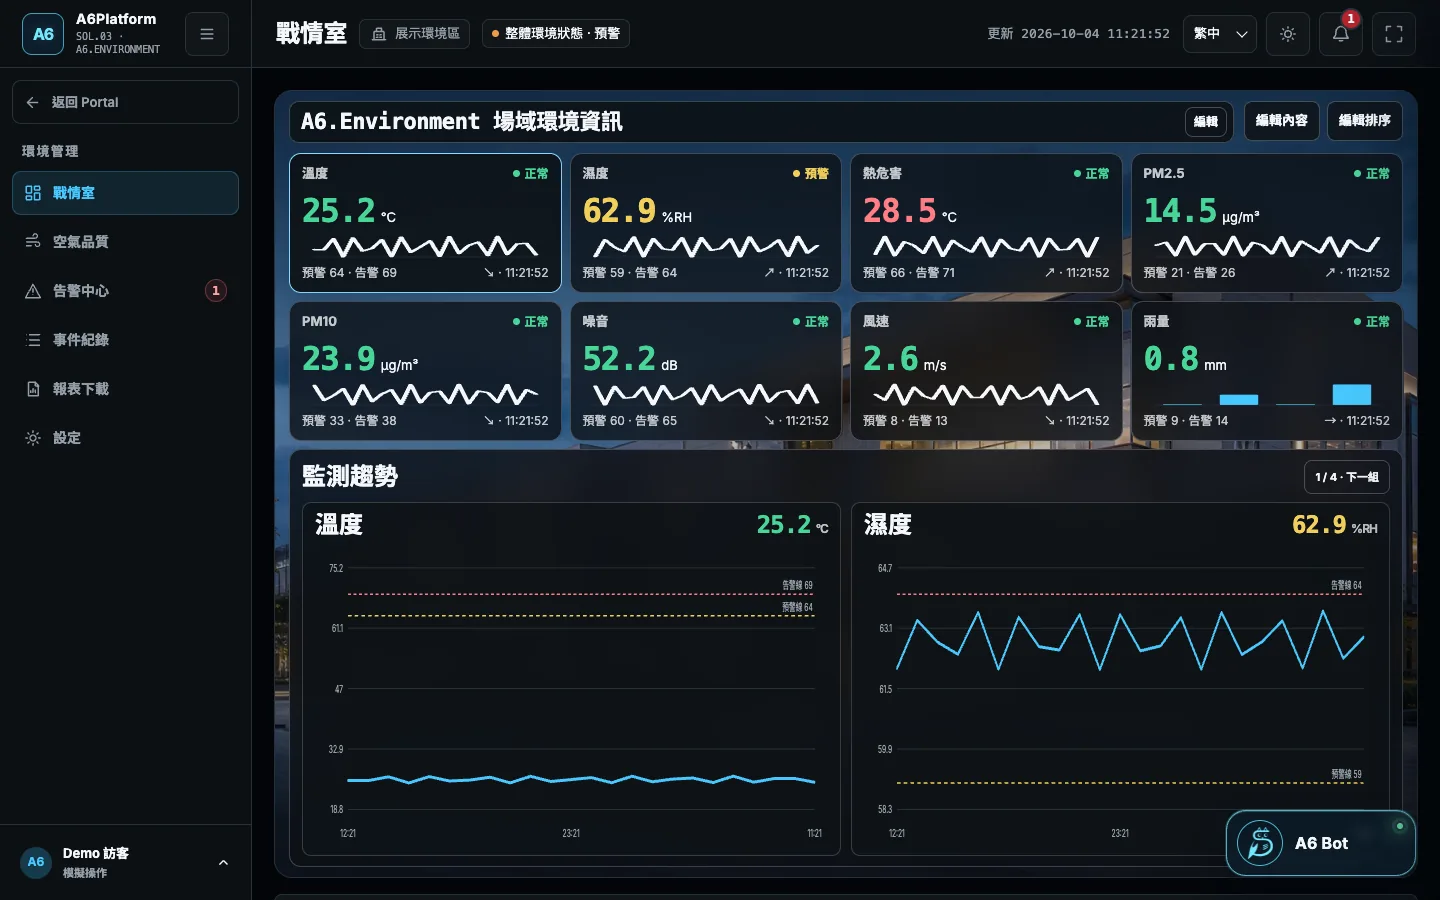
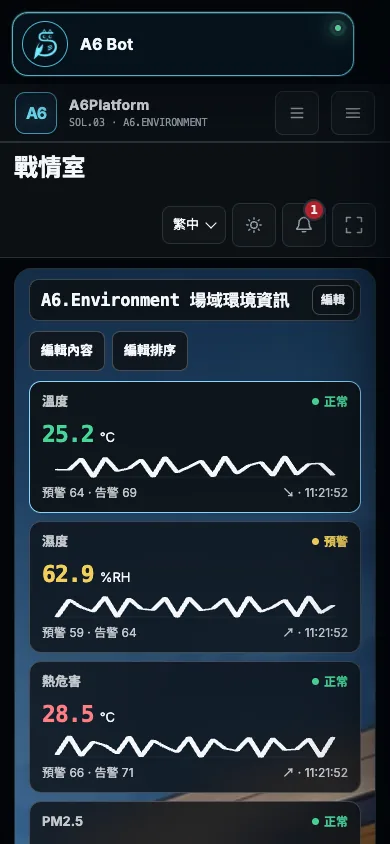
    A6Platform Environment war room screen (UI shown in Traditional Chinese)
    EIA-WAR-ROOMEnvironment war roomUI shown in Traditional Chinese.
    1. 1Temperature card
    2. 2Humidity warning
    3. 3Alarm and warning lines
  5. 05A6.Energy

    Energy Management & Sustainability Metrics

    Where and when is energy use changing?

    Discuss usage by equipment, area and time, along with performance, cost and reporting rules.

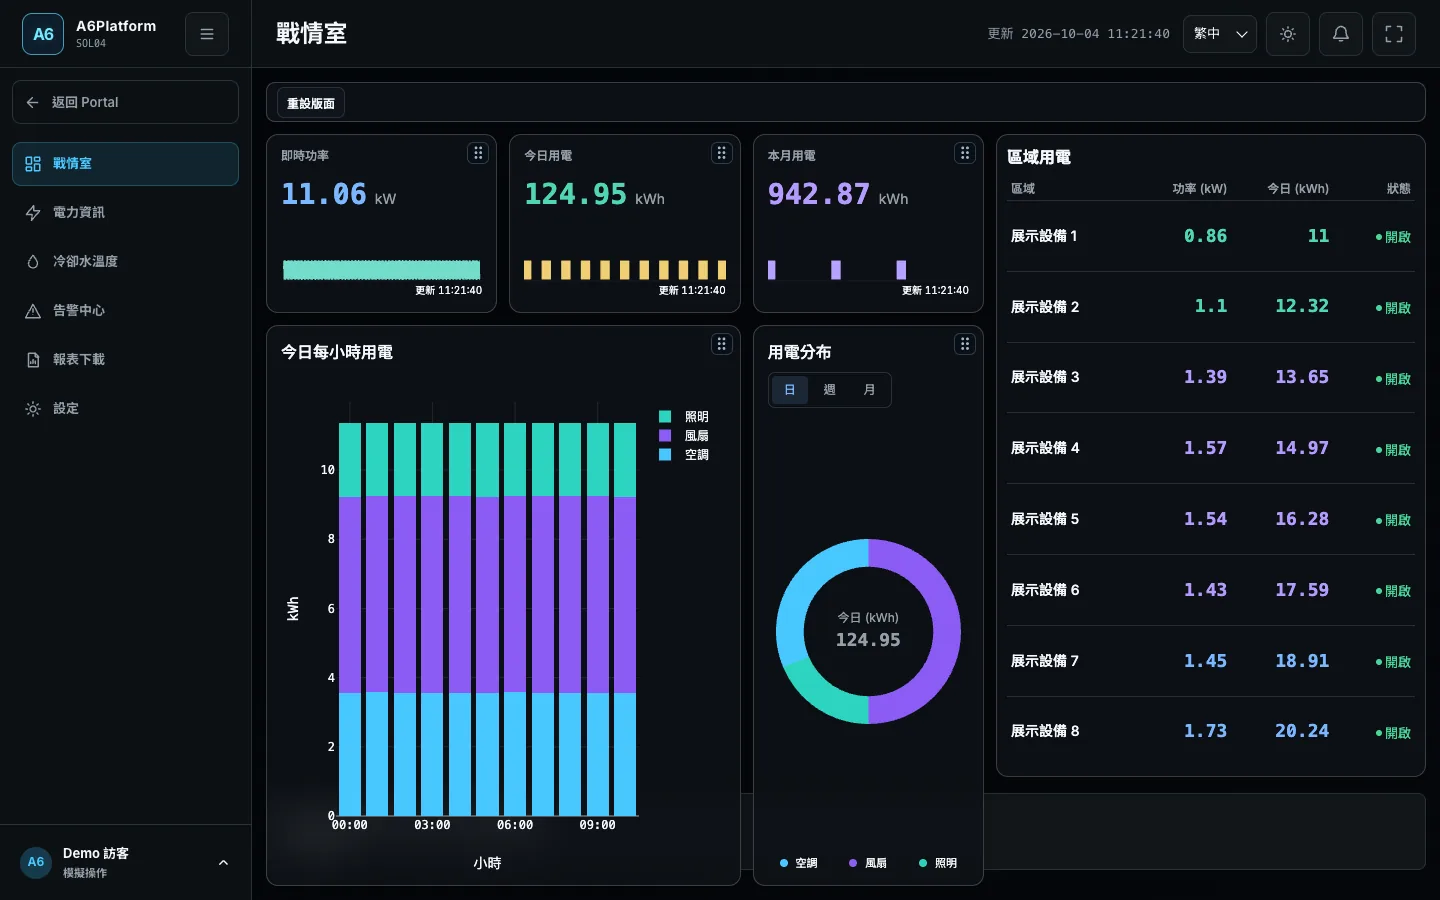
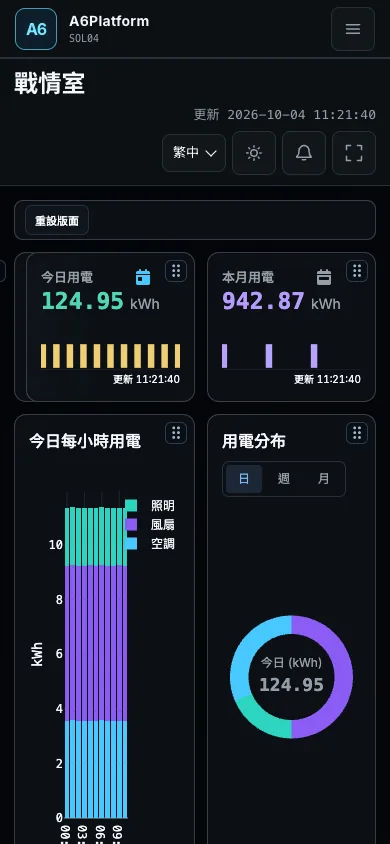
    A6Platform Energy war room screen (UI shown in Traditional Chinese)
    ESG-G62Energy war roomUI shown in Traditional Chinese.
    1. 1Live power
    2. 2Hourly use by load
    3. 3Usage by area

SHEET 02The Platform

Four modules. Start with the one you need most.

Start with one production line, equipment type or area, then expand as needs are confirmed.

01Machine overview
02Production board
03Downtime analysis

Which machine stopped? Where is the work order?

What the screens show

  • Running, stopped and alarm counts with today's output
  • Per-machine utilization, output vs. target, cycle time and current work order
  • Production board with shift progress and an alert ticker
  • Downtime-reason Pareto chart and downtime event timeline
UI shown in Traditional Chinese.View module A6.iAndon

SHEET 03A6.AI

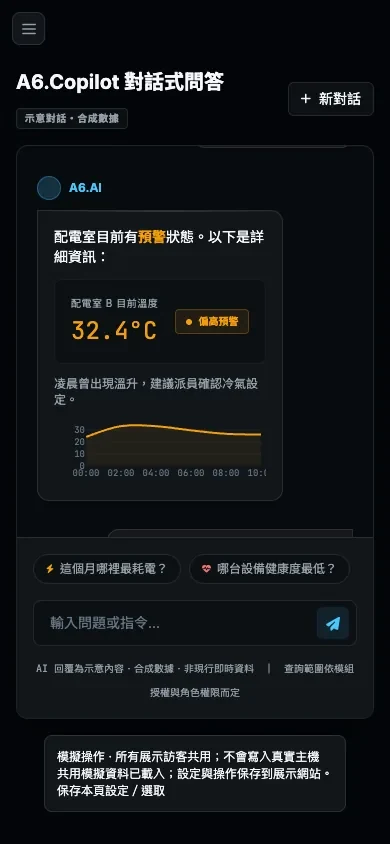
Ask the floor in plain language.

Every answer should point back to its source. AI proposes. You approve.

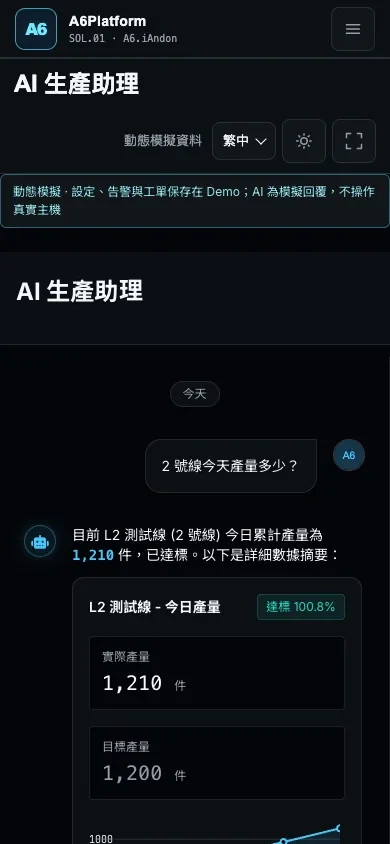
How many units has Line 2 made today? — L2 test line (Line 2) has produced 1,210 units today and is on target.

A6Platform AI production assistant screen (UI shown in Traditional Chinese)
IAN-G22Phone browser

Every answer should point back to its source.

  1. 01

    Understand the question

    Identify the machine, time and measure. Ask again when the request is unclear.

  2. 02

    Check permitted data

    Use the site's agreed data and access rules; confirm before any schedule change.

  3. 03

    Return to the record

    Link the answer to a board, schedule or report so a person can verify it.

Talk about your use case

SHEET 04Architecture

From field signals to management screens.

First inventory the PLCs, sensors and meters on site. Then confirm how to connect them, what each role needs to see and who should be notified when something changes.

01FIELD

Field layer

  • PLC
  • Machine signals
  • Meters
  • Sensors
  • Manually entered status

02EDGE

Edge layer

  • Industrial PC (IPC)
  • Data collection
  • Local logic
  • Signal processing

03PLATFORM

Platform layer

  • A6Platform
  • Dashboard
  • Alert rules
  • Role permissions

04OUTPUT

Phone / boards

  • Management views
  • Andon boards
  • Report exports
  • Improvement follow-up
  • A6.AI in a phone browser

Field layer → Edge layer → Platform layer → Phone / boards(Modbus · API / import)

  • 01Choose Modbus, API or file import based on the equipment.
  • 02Use edge equipment to collect, organize and transmit data.
  • 03Configure dashboards, alerts, reports and permissions by role.
  • 04Confirm connection and site-work scope before estimating cost and schedule.

SHEET 05Edge Hardware

Edge hardware.

Box, Node and Gateway hardware collect PLC, sensor and meter data on site. These are existing Season hardware references; fit with A6Platform, supported connections and project scope must be confirmed for each project.

HW-01

Field host Box (existing hardware)

A field host for collecting signals, local operation and upload buffering.

  • Installed beside a production line, in a server room or near the equipment.
  • A 7-inch touchscreen shows status and communications.
  • PLC, I/O, sensors or meters are connected according to the project.
Communication
Modbus TCP/IP ×1, Modbus RTU RS485 ×2
I/O
DI ×4, DO ×2
Power
AC 90–250 V
Operating environment
10–50°C, 10–90% RH (non-condensing)
Dimensions
25 × 35 × 19 cm
Specifications
Communication
Modbus TCP/IP ×1, Modbus RTU RS485 ×2
I/O
DI ×4, DO ×2
Power
AC 90–250 V
Operating environment
10–50°C, 10–90% RH (non-condensing)
Dimensions
25 × 35 × 19 cm
HW-02

Field host Box – internal layout (existing hardware)

A modular configuration designed for wiring, inspection and expansion.

  • Power, communications and control modules are arranged separately.
  • Modules can be inspected and replaced individually.
  • Configuration depends on cabinet space and signal requirements on site.
Design
Modular mainboard with expansion slots
Maintenance
Field-replaceable modules
Configuration
Adjusted to cabinet space and signal requirements on site
Specifications
Design
Modular mainboard with expansion slots
Maintenance
Field-replaceable modules
Configuration
Adjusted to cabinet space and signal requirements on site
HW-03

Machine-signal Node, 4 / 8 Port (existing hardware)

Collects machine status, Cycle Time and downtime events.

  • Connects RUN, STOP, ALARM, counters and manually reported events.
  • Data can be mapped to work orders, shifts, lines and machines.
  • Choose 4 Port or 8 Port according to machine count and distance.
Data
Cycle Time, production status, downtime
Ports
4 Port or 8 Port
Transmission
Wired
Specifications
Data
Cycle Time, production status, downtime
Ports
4 Port or 8 Port
Transmission
Wired
HW-04

Condition collection Box (existing hardware)

Brings vibration, temperature and current readings together for maintenance review.

  • For equipment such as motors, pumps, fans and cranes.
  • Provides trend, spectrum and alert data for review.
  • Sensor configuration and thresholds depend on the equipment.
Sensors
Up to 6 vibration or temperature transducer modules
Current
Supports up to 6 external current meters
Outputs
Equipment health, trends, alerts and maintenance recommendations
Specifications
Sensors
Up to 6 vibration or temperature transducer modules
Current
Supports up to 6 external current meters
Outputs
Equipment health, trends, alerts and maintenance recommendations
HW-05

Temperature collection module, 1–6 channel (existing hardware)

Collects environmental and hotspot readings, supporting 1–6 temperature channels.

  • For switchboards, cold-chain areas, warehouses or server rooms.
  • Temperature trends and alerts can be set by area and point.
  • Data supports environmental monitoring, event tracking and reports.
Channels
1–6 temperature channels
Data
Temperature, points, areas and event status
Applications
Electrical thermal risk, cold chain, warehousing and environmental monitoring
Outputs
Trends, alerts, event records and reports
Specifications
Channels
1–6 temperature channels
Data
Temperature, points, areas and event status
Applications
Electrical thermal risk, cold chain, warehousing and environmental monitoring
Outputs
Trends, alerts, event records and reports
HW-06

Meter data collection (existing hardware)

Collects meter and circuit information for energy management.

  • For main meters, submeters, production lines and equipment.
  • Connection depends on the existing meter and communications.
  • Provides data for usage, ENPI, alerts and cost reports.
Data
Voltage, current, power, demand and energy use (subject to meter support)
Connection
Meter, power meter or circuit data; site communications need confirmation
Applications
Site electricity use, equipment consumption, energy performance and cost allocation
Outputs
Energy dashboard, alerts, ENPI and reports
Specifications
Data
Voltage, current, power, demand and energy use (subject to meter support)
Connection
Meter, power meter or circuit data; site communications need confirmation
Applications
Site electricity use, equipment consumption, energy performance and cost allocation
Outputs
Energy dashboard, alerts, ENPI and reports

END · Next step

What would you most like to solve on site?

An equipment list, a panel photo or a problem you face every day is enough to start.

  1. 01An equipment list
  2. 02A panel photo
  3. 03A problem you face every day