Updated Digital Manufacturing Management
- Case ID
- IANDON-02
- Module
- A6.iAndon
- Application
- Overseas plant upgrade
- Industry
- Metal parts manufacturer with an overseas plant
See how long a stop lasts and what it is waiting on—from the floor board.
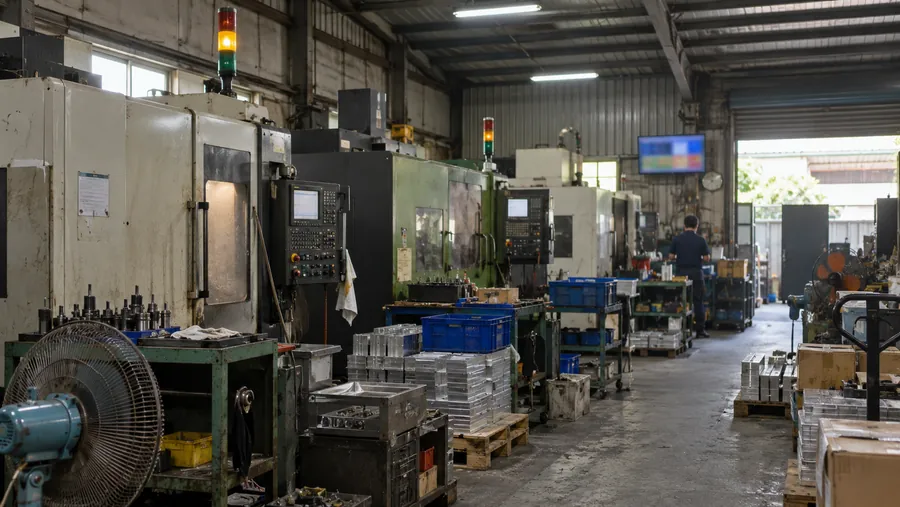
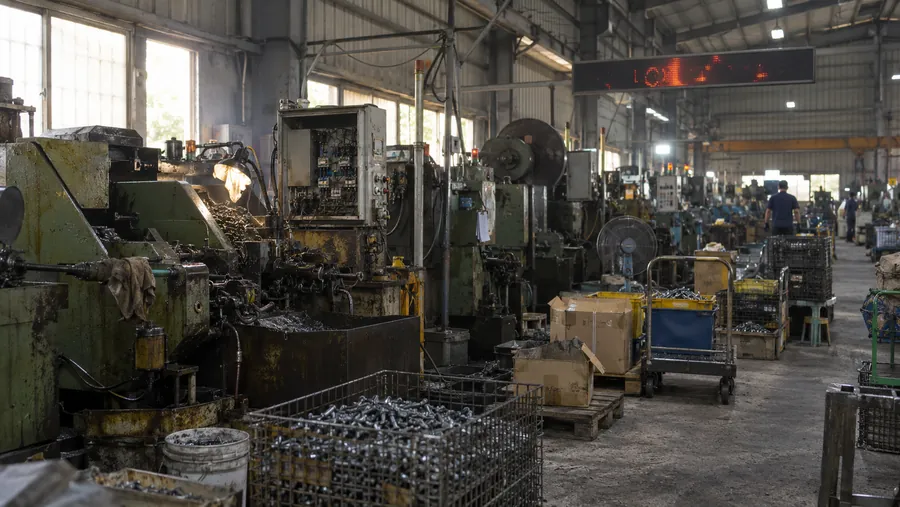
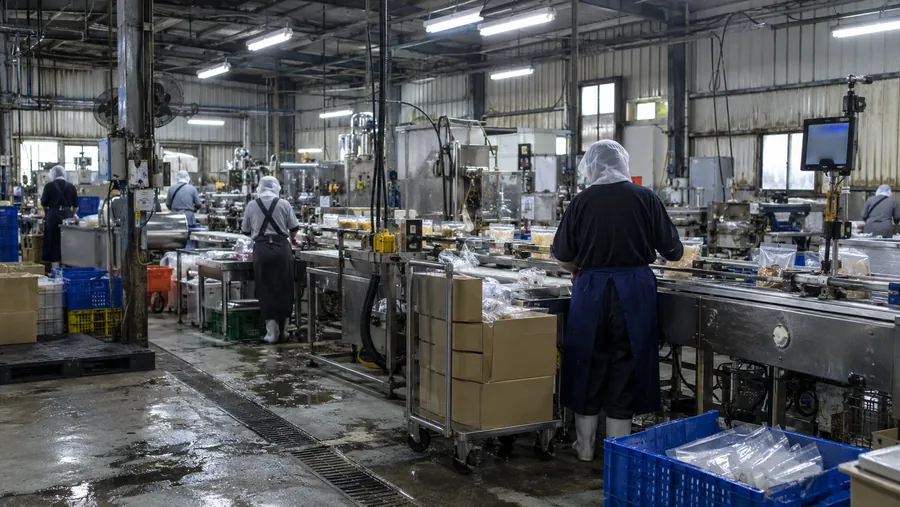
The production line presents machine status and downtime reasons on one board. Floor teams and supervisors can review stop duration, material waits and response progress, reducing the need to ask one person at a time.
From the site problem to a system approach.
- 01The challenge
Schedules and floor status are out of sync, leaving improvement meetings without consistent machine and work-order data.
- 02The system approach
Bring together machine status, schedules, downtime reasons and production-board information so teams can track operations instead of relying on repeated follow-up.
- 03Reported outcome
Improve visibility of floor status and make coordination between production planning and line supervisors easier.
System architecture and data flow.
Edge nodes collect RUN/STOP/ALARM and output signals; the platform layer provides role-based dashboards. Source diagrams retain some original Traditional Chinese labels.
- 工廠 Dashboard
- Andon 大看板
- LINE / Email 推播
- Excel 報表
- CaseOne floor board
- 工廠 Dashboard即時稼動率 / OEE · 產線狀態
- Andon 大看板停機與異常 · 現場即時顯示
- LINE / Email 推播停線通知 · 警報群組
- Excel 報表工單下載 · 改善追蹤
- Case signalOne floor boardSource|Case story:The production line presents machine status and downtime reasons on one board. Floor teams and supervisors can review stop duration, material waits and response progress, reducing the need to ask one person at a time.
REST API · WebSocket · LINE Webhook- Overview
- Dashboard
- Downtime History
- Database
- Production Reports
- CaseStop duration and material waits
- Overview產線總覽 · 即時狀態
- DashboardOEE / 稼動率 · 工單進度
- Downtime History停機事件 · 原因分析
- Database生產紀錄 · 報表資料
- Production Reports日 / 週 / 月報 · Excel 匯出
- Case signalStop duration and material waitsSource|Case story:The production line presents machine status and downtime reasons on one board. Floor teams and supervisors can review stop duration, material waits and response progress, reducing the need to ask one person at a time.
TCP/IP over HTTPS- iAndon Node
- 既有平台 Box
- 斷網本地暫存
- iAndon NodeDI / AI / 通訊接入 · 現場事件採集
- 既有平台 BoxIPC + HMI + Switch · 本地資料整理
- 斷網本地暫存網路恢復後補傳 · 避免資料遺失
Modbus TCP / MQTT / API- 機台 / PLC 狀態
- 產量計數
- 工單 / 排程資料
- 停機原因輸入
- CaseMachine status and downtime reasons
- 機台 / PLC 狀態RUN / STOP / ALARM · DI 或 API
- 產量計數計數器 / 光電開關 · 乾接點或脈波
- 工單 / 排程資料MES / Excel / API · 工單匯入
- 停機原因輸入現場看板 / 平板 · 人工原因碼
- Case signalMachine status and downtime reasonsSource|Case story:The production line presents machine status and downtime reasons on one board. Floor teams and supervisors can review stop duration, material waits and response progress, reducing the need to ask one person at a time.
Wiring diagrams and hardware configuration.
The diagram outlines data flow between site signals, edge devices, the network and the platform. Confirm installation and connection scope before work begins.
Original diagram notes (Traditional Chinese)
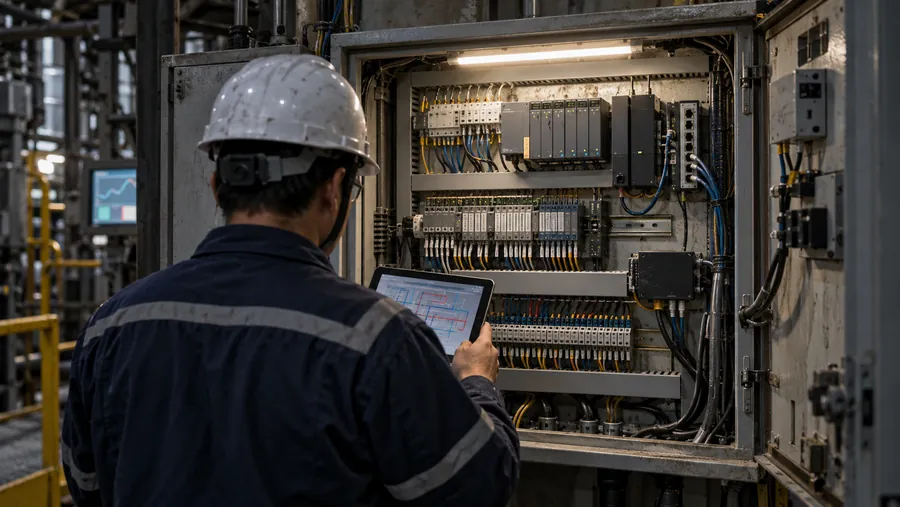
- 01主機櫃 / Main equipment cabinet 內含 24VDC PSU、既有平台 Box、iAndon Node
- 0224VDC PSU(100~240VAC, 單相 / DC 24V / 5A / 工業電源)以 24VDC 紅虛線供電給 既有平台 Box 與 iAndon Node
- 03既有平台 Box(IPC / HMI / Switch、本地資料整理、斷網本地暫存)與 iAndon Node(DI / AI / Modbus、現場訊號採集)以 Modbus TCP / MQTT 藍線連接
- 04既有平台 Box 上行至 既有平台 Cloud(部署於雲端 / 台灣):TCP/IP over HTTPS via customer LAN(綠線)
- 054× 現場訊號 / 表計 / 感測器資料以橙線接入 iAndon Node:產線 A(PLC / 光電 / 計數,DI-1);產線 B(PLC / 光電 / 計數,DI-2);產線 C(PLC / 光電 / 計數,DI-3);產線 D(PLC / 光電 / 計數,DI-4)
TOTAL既有平台 Box + iAndon Node + 現場點位 / 表計 / 感測器 = iAndon 基準配置
Sensors, PLCs, edge gateways and communication modules are selected around the equipment already available at the site.
Original diagram notes (Traditional Chinese)
- HW-01現場訊號來源設備 / 表計 / 感測器;狀態、數值、事件
- HW-02iAndon Node接收現場訊號;轉換通訊資料
- HW-03既有平台 Box本地資料整理;斷網暫存 / 上傳
- HW-0424VDC PSU工業電源;低壓供電
- HW-05既有平台 CloudDashboard / 告警 / 報表;角色權限與資料庫
What to confirm before work begins.
This material describes a planning direction. Confirm site points, installation, report definitions and alert rules against actual site conditions.
- 01Site points and signal sources
- 02Communication protocols and network conditions
- 03Power, panels and installation method
- 04Report fields and data definitions
- 05Alert rules and responsible people
- 06Equipment brands, models and quantities
END · Next step
What would you most like to solve on site?
An equipment list, a panel photo or a problem you face every day is enough to start.
- 01An equipment list
- 02A panel photo
- 03A problem you face every day