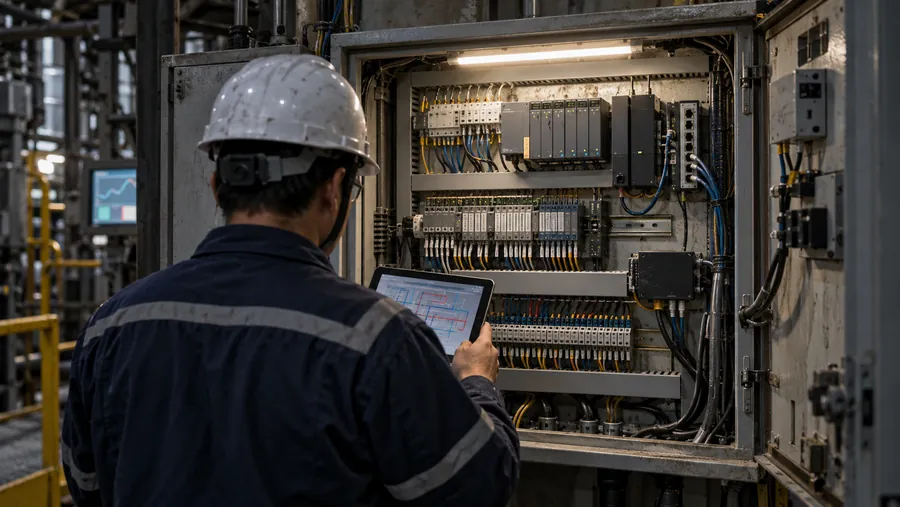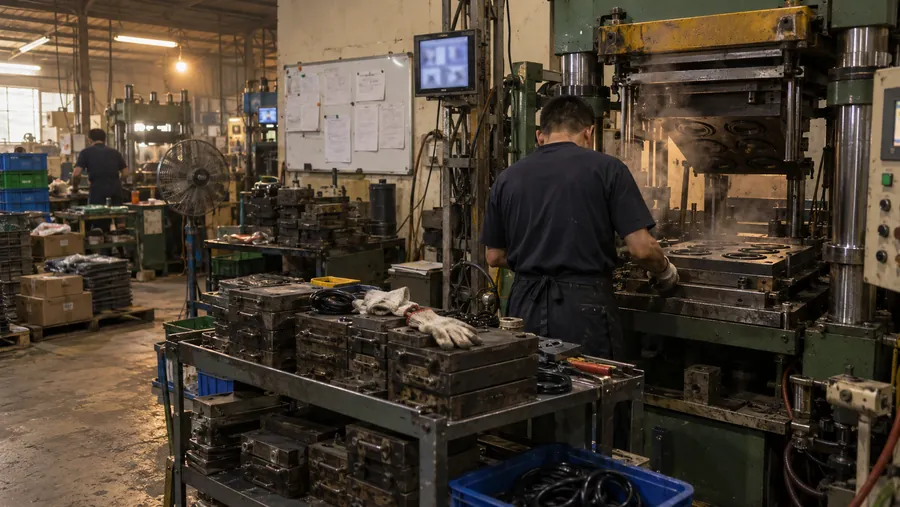
Real-Time Visualization and Efficiency Improvement
- Case ID
- IANDON-06
- Module
- A6.iAndon
- Application
- Efficiency improvement
- Industry
- Rubber seal manufacturer
How much time goes to waiting for material, mold changes or inspection?
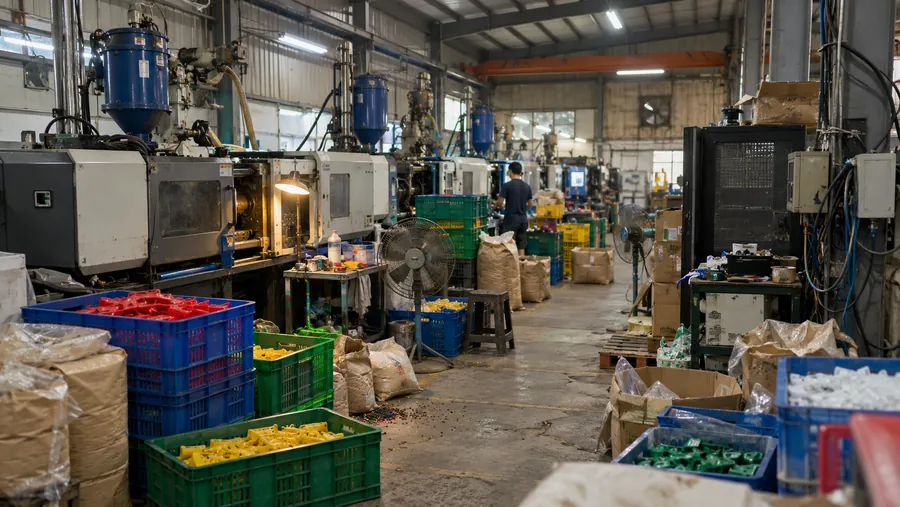
The rubber seal manufacturer records downtime reasons and duration on its vulcanizing line, then compiles them into downtime analysis and production reports. Improvement meetings can use the observed distribution to choose what to address first.
From the site problem to a system approach.
- 01The challenge
Downtime, waiting, changeovers and report preparation are treated as routine costs, but records may be hard to trace.
- 02The system approach
Use real-time dashboard, downtime-analysis and production-report views as a source for improvement discussions.
- 03Reported outcome
Move improvement discussions from impressions toward data-based tracking.
System architecture and data flow.
Floor signals enter the edge data-collection layer; the existing platform turns them into schedule, alert and management-report views. Source diagrams retain some original Traditional Chinese labels.
- 工廠 Dashboard
- Andon 大看板
- LINE / Email 推播
- Excel 報表
- CaseImprovement meetings
- 工廠 Dashboard即時稼動率 / OEE · 產線狀態
- Andon 大看板停機與異常 · 現場即時顯示
- LINE / Email 推播停線通知 · 警報群組
- Excel 報表工單下載 · 改善追蹤
- Case signalImprovement meetingsSource|Case story:The rubber seal manufacturer records downtime reasons and duration on its vulcanizing line, then compiles them into downtime analysis and production reports. Improvement meetings can use the observed distribution to choose what to address first.
REST API · WebSocket · LINE Webhook- Overview
- Dashboard
- Downtime History
- Database
- Production Reports
- CaseDowntime analysis
- Overview產線總覽 · 即時狀態
- DashboardOEE / 稼動率 · 工單進度
- Downtime History停機事件 · 原因分析
- Database生產紀錄 · 報表資料
- Production Reports日 / 週 / 月報 · Excel 匯出
- Case signalDowntime analysisSource|Case story:The rubber seal manufacturer records downtime reasons and duration on its vulcanizing line, then compiles them into downtime analysis and production reports. Improvement meetings can use the observed distribution to choose what to address first.
TCP/IP over HTTPS- iAndon Node
- 既有平台 Box
- 斷網本地暫存
- iAndon NodeDI / AI / 通訊接入 · 現場事件採集
- 既有平台 BoxIPC + HMI + Switch · 本地資料整理
- 斷網本地暫存網路恢復後補傳 · 避免資料遺失
Modbus TCP / MQTT / API- 機台 / PLC 狀態
- 產量計數
- 工單 / 排程資料
- 停機原因輸入
- CaseVulcanizing-line downtime
- 機台 / PLC 狀態RUN / STOP / ALARM · DI 或 API
- 產量計數計數器 / 光電開關 · 乾接點或脈波
- 工單 / 排程資料MES / Excel / API · 工單匯入
- 停機原因輸入現場看板 / 平板 · 人工原因碼
- Case signalVulcanizing-line downtimeSource|Case story:The rubber seal manufacturer records downtime reasons and duration on its vulcanizing line, then compiles them into downtime analysis and production reports. Improvement meetings can use the observed distribution to choose what to address first.
Wiring diagrams and hardware configuration.
The diagram outlines data flow between site signals, edge devices, the network and the platform. Confirm installation and connection scope before work begins.
Original diagram notes (Traditional Chinese)
- 01主機櫃 / Main equipment cabinet 內含 24VDC PSU、既有平台 Box、iAndon Node
- 0224VDC PSU(100~240VAC, 單相 / DC 24V / 5A / 工業電源)以 24VDC 紅虛線供電給 既有平台 Box 與 iAndon Node
- 03既有平台 Box(IPC / HMI / Switch、本地資料整理、斷網本地暫存)與 iAndon Node(DI / AI / Modbus、現場訊號採集)以 Modbus TCP / MQTT 藍線連接
- 04既有平台 Box 上行至 既有平台 Cloud(部署於雲端 / 台灣):TCP/IP over HTTPS via customer LAN(綠線)
- 054× 現場訊號 / 表計 / 感測器資料以橙線接入 iAndon Node:產線 A(PLC / 光電 / 計數,DI-1);產線 B(PLC / 光電 / 計數,DI-2);產線 C(PLC / 光電 / 計數,DI-3);產線 D(PLC / 光電 / 計數,DI-4)
TOTAL既有平台 Box + iAndon Node + 現場點位 / 表計 / 感測器 = iAndon 基準配置
Sensors, PLCs, edge gateways and communication modules are selected around the equipment already available at the site.
Original diagram notes (Traditional Chinese)
- HW-01現場訊號來源設備 / 表計 / 感測器;狀態、數值、事件
- HW-02iAndon Node接收現場訊號;轉換通訊資料
- HW-03既有平台 Box本地資料整理;斷網暫存 / 上傳
- HW-0424VDC PSU工業電源;低壓供電
- HW-05既有平台 CloudDashboard / 告警 / 報表;角色權限與資料庫
What to confirm before work begins.
This material describes a planning direction. Confirm site points, installation, report definitions and alert rules against actual site conditions.
- 01Site points and signal sources
- 02Communication protocols and network conditions
- 03Power, panels and installation method
- 04Report fields and data definitions
- 05Alert rules and responsible people
- 06Equipment brands, models and quantities
END · Next step
What would you most like to solve on site?
An equipment list, a panel photo or a problem you face every day is enough to start.
- 01An equipment list
- 02A panel photo
- 03A problem you face every day